


INTRODUCTION
Mixed urinary incontinence (UI) is characterized by a combination of stress UI (SUI) and symptoms of overactive bladder (OAB), according to the definition provided by the International Continence Society [1]. Mixed UI can manifest with varying degrees of stress and urge predominance. Optimized and standardized approaches for the treatment of mixed UI are currently lacking. Furthermore, the factors that exclusively predict the postoperative outcomes of mixed UI remain unclear. Mixed UI often presents with diverse clinical features, necessitating a comprehensive evaluation that includes medical history assessment, physical examination, imaging studies, and urodynamic assessments to achieve an accurate diagnosis. By elucidating the risk factors that influence the success rate of mixed UI, which generally demonstrates a lower success rate than pure SUI, the treatment outcomes can be optimized and comprehensive guidance provided to patients considering surgical intervention. Therefore, the objective of our study was to identify the predictive clinical factors associated with the postoperative cure rate and satisfaction in female patients with equal severity of SUI and urge UI (UUI).
METHODS
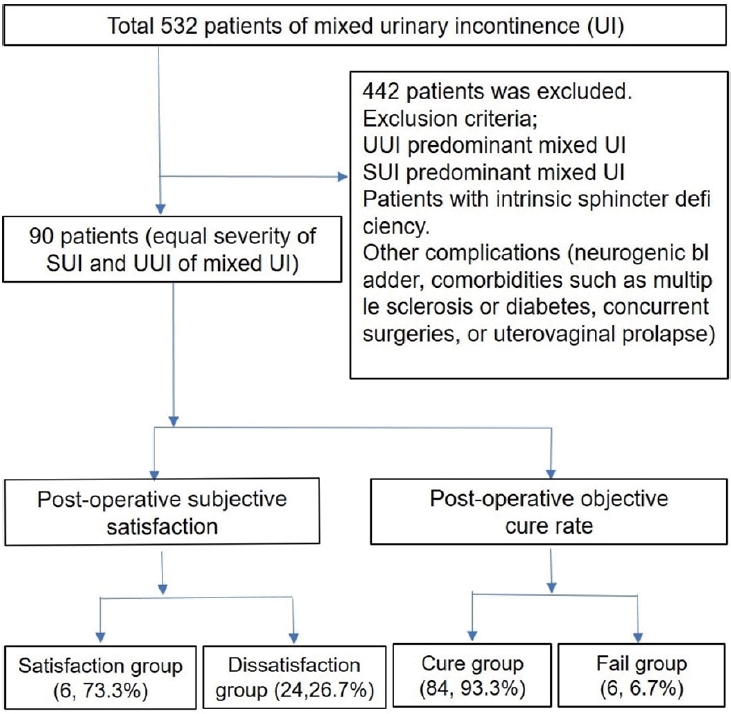
This retrospective study was approved by the institutional review board of Jeju National University (JEJUNUH 2017-01-006). Between January 2010 and April 2022, 532 patients with mixed UI underwent urodynamic studies using a standardized protocol (Fig. 1) [2]. All patients were categorized as having an equal severity of SUI and UUI based on the urinary symptom scores obtained from the KingŌĆÖs health questionnaire (KHQ) [3]. Among them, 90 patients diagnosed with equal severity SUI and UUI underwent trans-obturator tape (TOT) at a single center. Patients with stress- or urge-predominant mixed UI were excluded. The study also excluded patients with intrinsic sphincter deficiency and other complications (neurogenic bladder, comorbidities such as multiple sclerosis or diabetes, concurrent surgeries, or uterovaginal prolapse). The patients were followed-up for at least 12 months after TOT, during which no additional anticholinergic agents were administered for the management of urge symptoms. We analyzed the cure rate and satisfaction by evaluating patientsŌĆÖ perceived satisfaction and changes in symptoms after undergoing the TOT procedure. The postoperative cure rate was categorized into three groups: cure, improvement, and failure [4]. Additionally, the postoperative cure status was divided into the cure group (CG), including patients with cure and improvement, and the failure group (FG) for patients who did not experience significant improvement. Postoperative satisfaction was classified into four groups: very satisfied, satisfied, no change, and dissatisfied. Furthermore, postoperative satisfaction was divided into the satisfaction group (patients who reported being very satisfied or satisfied, SG) and the dissatisfaction group (patients who reported no change or dissatisfied, DG). All patients underwent a comprehensive examination, a full urodynamic study, documentation of a 3-day voiding chart, and scoring of the symptoms section of the KHQ. Statistical analyses were performed using the chi-square test or StudentŌĆÖs t-test for categorical variables. Univariate logistic regression analysis was conducted to identify risk factors affecting postoperative outcomes, and independent risk factors were determined using multivariate logistic regression analysis. Statistical significance was set at P<0.05.
RESULT
Based on postoperative subjective satisfaction, 66 patients (73.3%) were classified in the SG and 24 patients (26.7%) in the DG. Regarding the postoperative cure rate, 84 patients (93.3%) were classified in the CG, while six patients (6.7%) were in the FG. The mean age of the patients was 55.4┬▒1.1 years, with a body mass index (BMI) of 26.3┬▒0.3 kg/m2. The mean values of urodynamic parameters were as follows: bladder capacity, 337.1┬▒12.5 mL; detrusor pressure at peak urinary flow (Pdetmax), 36.7┬▒1.3 cmH2O; Qmax, 18.8┬▒0.8 mL/s; residual urine (RU), 23.1┬▒4.6 mL; maximal urethral closing pressure (MUCP), 29.6┬▒1.2 cmH2O; Valsalva leak point pressure (VLPP), 72.6┬▒2.9 cmH2O (Table 1). There were significant differences between the SG and DG in terms of VLPP (P=0.041), BMI (P=0.028), and OAB symptom score (OABSS, P<0.001) (Table 2). Similarly, significant differences were observed between the CG and FG in VLPP (P=0.011) and OABSS (P<0.001) (Table 3). Univariate analysis revealed that BMI, total capacity, and OABSS were associated with postoperative satisfaction, while VLPP and OABSS were related to the postoperative cure rate. In the multivariate analysis, OABSS (adjusted odds ratio [OR], 0.150; P=0.001) and BMI (adjusted OR, 0.860; P=0.032) were identified as independent predictors of postoperative satisfaction, whereas VLPP (adjusted OR, 1.047; P=0.023) was the only independent predictor for the postoperative cure rate (Table 4).
DISCUSSION
Mixed UI is characterized by complaints of involuntary urinary incontinence combined with urgency and abdominal pressure. However, there are currently no established treatment guidelines for mixed UI. The differentiation between stress- and urge-predominant mixed UI is primarily based on patient symptoms. Consequently, definitive anti-incontinence treatments have not been established for the management of mixed UI. The primary focus is on initially addressing the most bothersome symptoms [5]. Mixed UI is a common form of UI. However, definitive indicators for quantifying the dominance of stress or urge components in mixed UI are lacking. This differentiation is particularly important because patients with mixed UI often present with more uncomfortable symptoms than those with SUI or UUI alone [6]. Therefore, there is a need to prioritize the treatment of the predominant symptoms in mixed UI [7]. Currently, the assessment of stress and urge severity in patients with mixed UI relies on subjective measures such as the urinary symptom section of the KHQ. In our study, all patients were diagnosed with urodynamic mixed UI and were selected based on equal severity of stress and urge symptoms using the Korean version of the KHQ. Most mixed UI patients had more than 50% of patients with mixed UI exhibited an unequal predominance of SUI and UUI. An equal severity of stress and urge UI was smaller [8]. Our aim was to evaluate patient satisfaction and cure rates after surgery, specifically focusing on minimizing differences in predominant symptoms to obtain fairer and more informative results. Previous reports have indicated that 50-74% of patients with mixed UI achieve complete recovery after anti-incontinence surgery alone [9]. A systematic meta-analysis of mid-urethral slings in patients with mixed UI reported an overall subjective cure rate of 56% [10]. Success rates after mid-urethral slings varied depending on the degree of UUI [11]. To minimize the differentiation of outcomes according to symptom severity, we focused on equal severity of SUI and UUI in our study. The postoperative satisfaction and cure rates were 73.3% and 93.3%, respectively. In one study, tension-free vaginal tape (TVT) surgery demonstrated an 85% cure rate for both stress and urge factors in mixed UI, with only an 11% failure rate, indicating the effectiveness of TVT in treating mixed UI [12]. It has been reported that anti-incontinence surgery can achieve a complete cure for both stress and urge components in 50-77.5% of mixed UI cases, except for severe urge-predominant cases, compared to that of SUI [13]. However, the cure rate for mixed UI is not as high as that for SUI. The satisfaction rate after transobturator TVT (TVT-O) for mixed UI was approximately 62.8% [14]. In our study, the postoperative satisfaction rate was 73.3% and the cure rate was 93.3% for patients with equal severity of stress and urge symptoms in urodynamic mixed UI. Regarding BMI, no significant differences were observed in the subjective cure rates [15]. However, our data showed that BMI and OABSS had an impact on postoperative satisfaction according to multivariate analysis. Significantly higher postoperative satisfaction rates were found in patients with normal BMI than in obese individuals (P=0.008) and in patients with mild OABSS symptoms than in those with severe symptoms (P<0.001). In a previous study, VLPP was not identified as a significant predictive factor for the cure rate following sling surgery [16]. However, in our study, a significant difference in the postoperative cure rate was noted between patients with VLPP ranging from 60 to 90 cmH2O (P=0.001). Another study found no significant predictive factors for mixed UI after TVT surgery [17]. The authorsŌĆÖ research indicated that a higher VLPP was associated with higher postoperative cure rates, while lower BMI and OABSS were associated with higher postoperative satisfaction. Moreover, mixed UI can manifest with varying degrees of stress and urge. Therefore, to minimize differences in postoperative outcomes, we specifically focused on patients with equal severity of SUI and UUI in our study. By identifying the predictive factors that influence the success rate of mixed UI, which has a relatively lower success rate than pure SUI, we can achieve optimal treatment outcomes and provide valuable counseling to patients considering surgery. This study aimed to investigate these predictive factors and their impact on treatment outcomes in patients with mixed UI, contributing to the advancement of clinical practice and enhancing patient care.
This study has three main limitations. The first was the small number of participants. Second, we were unable to identify all possible factors. Finally, this design excludes the possibility of residual confounding factors.
 PDF Links
 PubReader
 ePub Link
 Full text via DOI
 Download Citation
 Print
Print