


INTRODUCTION
Coronavirus disease 2019 (COVID-19), officially named by the World Health Organization (WHO) on February 11, 2020, is an infectious respiratory disease caused by severe acute respiratory syndrome coronavirus 2 (SARS-CoV-2), a single-stranded ribonucleic acid genome virus [1,2].
Regarding the main epidemiological characteristics of COVID-19, its infection period begins even before symptom onset, and the highest viral load is found at an early stage [3,4]. Accordingly, the Korea Disease Control and Prevention Agency (KDCA) has implemented testing and self-isolation for persons who were in close contact 2 days prior to the clinical symptom onset of newly confirmed cases during the epidemiological investigation [1,5]. In addition, the suspected symptoms of COVID-19 are non-specific, and some cases show mild symptoms [6,7]. Moreover, in some cases, patients are asymptomatic, and the disease is only confirmed after testing for other reasons. During the epidemiological investigation, some patients started to recollect that they manifested COVID-19-related symptoms, while others were asymptomatic [8]. If confirmed COVID-19 patients fail to recognize the suspected symptoms, it becomes a substantial hindrance in the efforts to control local community transmission. Thus, a rapid and accurate test is of the utmost importance [9,10].
To confirm COVID-19, the WHO and the KDCA recommend the use of real-time reverse transcription-polymerase chain reaction (RT-PCR) to amplify RNA-dependent RNA polymerase (RdRp) and envelope (E) genes of SARS-CoV-2 [1,4,7,9,11,12], in which cycle threshold (CT) values for the two genes are obtained [7,13]. The RT-PCR CT values determine the viral load of the corresponding specimen [7,14,15]. Thus, the CT values can be used to estimate the infection period of the confirmed cases, which can then be used for the epidemiological investigation [13,16,17]. Therefore, the symptom onset time of confirmed cases who identified themselves as asymptomatic using the CT values can be assumed. The present study aimed to determine the relationship between the intervals (days) from symptom onset to the testing of CT values using RT-PCR, with confirmed cases that specifically disclosed the time of symptom onset. Once it becomes possible to predict the time of symptom onset more accurately in individual confirmed cases using the derived relationship, highly contagious contacts of patients can be completely identified, and viral transmission to local communities can be effectively prevented.
METHODS
Of the confirmed cases in Jeju Province for which the nasal or oral specimens for COVID-19 testing were collected before or on March 9, 2021, individuals who specifically disclosed the day of the onset of suspected symptoms during the epidemiological investigation were included in the present study. From basic and in-depth epidemiological reports, data for sex, date of birth, symptom onset day, specimen collection day, and CT values of RdRp and E genes (CTR and CTE, respectively) were obtained. The RT-PCR was conducted at the Jeju Special Self-Governing Province Institute of Environment Research, a test institution officially designated by the KDCA.
Following the calculation of age based on birth date and collection day, the cases were categorized into the following four groups based on patient age: ≤19, 20-39, 40-59, and ≥60 years. The interval was defined as the number of days between the onset of COVID-19 suspected symptoms based on the information provided by the confirmed cases and specimen collection. To apply the regression analysis to the estimation, interval days with only one case were excluded from the analysis.
The Pearson correlation coefficient was calculated for the correlation analysis between CTR and CTE. A paired t-test was used to examine any statistical differences between the CTR and CTE that were paired by case. To test CTR and CTE differences by sex, t-tests and Mann-Whitney tests were used. In addition, analysis of variance and the Kruskal-Wallis test were used to analyze CTR and CTE differences by age group and number of interval days. Through such univariate analyses, variables with a 10% or lower P-value were defined as potential explanatory variables, followed by a general regression analysis using CTR and CTE values as outcome variables. A non-linear relationship between the interval days and CTR and CTE was tested using a locally weighted regression smoothing (LOWESS) curve [18]. In the case of a U-shaped parabolic curve, the polynomial regression model was applied with a quadratic term [19], and then the 95% confidence interval (CI) values of the CTR and CTE by interval day were estimated using the derived polynomial regression equation [20]. These analyses were performed using STATA 15 (StataCorp, College Station, TX, USA) statistical program, in which the statistical significance level was set as 0.05. This study was approved by the Institutional Review Board of Jeju National University (approval No. 2021-034).
RESULT
Of the 335 cases that satisfied the inclusion criteria, there was only one case each for the 11, 12, 13, and 14 interval days from clinical symptom onset until the test date. Thus, these four cases were excluded, resulting in a total of 331 subjects. The Pearson correlation coefficient between CTR and CTE in each case was 0.985, and the paired t-test revealed a significant difference (P<0.001). Thus, a statistical analysis was performed for each CTR and CTE.
Distributions of CTR and CTE according to sex, age, and interval are shown in Table 1. There was no difference in CTR and CTE distribution according to sex (150 men and 181 women subjects) (P=0.306 for CTR; P=0.177 for CTE). The distributions of CTR and CTE in the four age groups exhibited borderline statistical significance (P=0.072 in CTR and P=0.066 in CTE). In addition, the CTR and CTE distributions by interval showed statistically significant differences (P<0.001). Thus, a general regression analysis was applied to the CTR and CTE outcome values, with each interval day as an independent variable, with adjustment for age group.
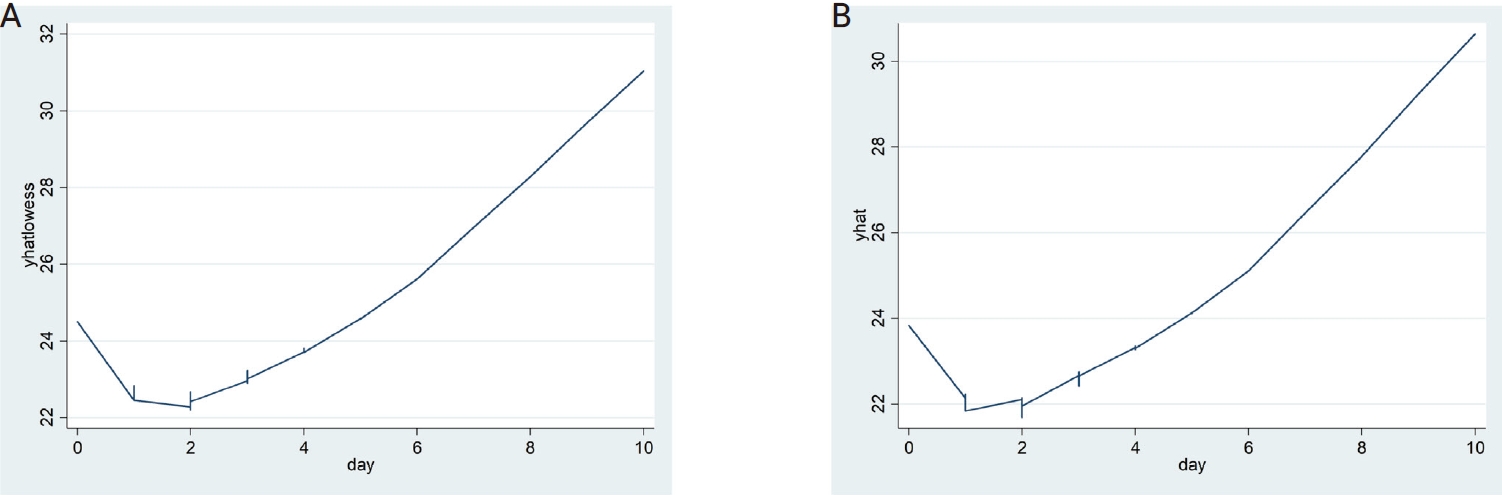
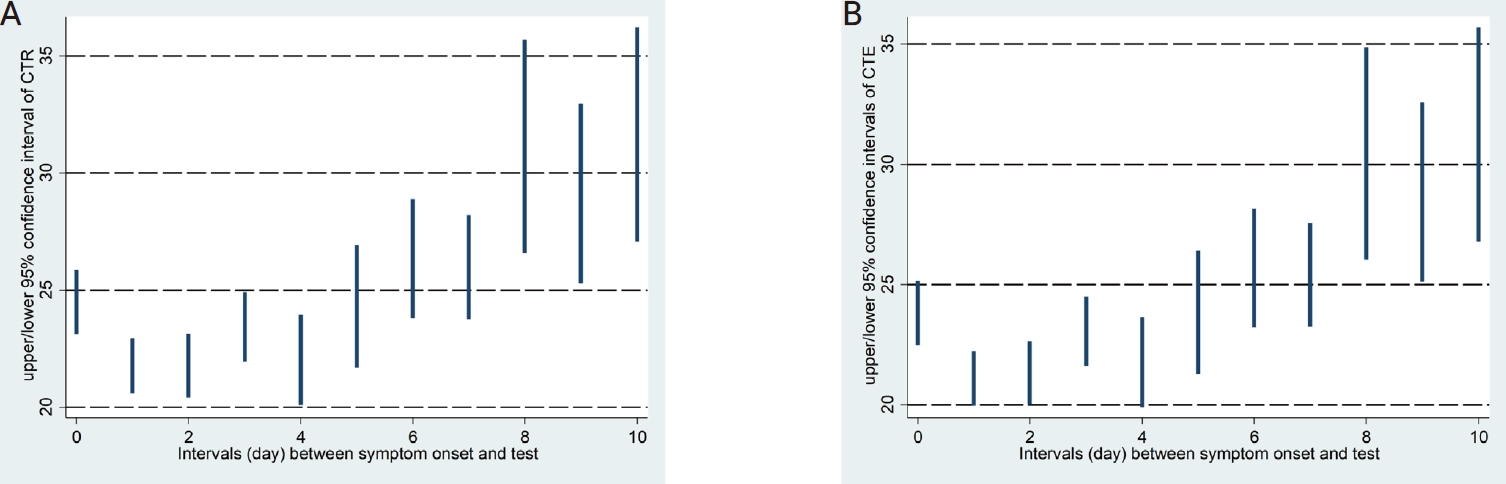
The LOWESS curves between the interval days and CTR and CTE showed U-shaped relationships, and both had inflection points on the second day of the interval (Fig. 1). Accordingly, a polynomial regression analysis was performed by applying a quadratic term, as shown in Table 2, in which a statistically significant contribution from the nonlinear terms was found. The predicted values of the 95% CI for the CTR and CTE values by interval based on the regression models are shown in Table 3 and Figure 2.
DISCUSSION
In cases where the interval between the onset of COVID-19 suspected symptoms and specimen collection was identified during the epidemiological investigation, a polynomial regression equation was generated to determine the relationship between the CTR and CTE values by interval after adjusting for age groups. As shown in Table 2, the quadratic polynomial regression equations were generated for each of CTR and CTE, based on which 95% CI values of estimated CTR and CTE values by interval were obtained as in Table 3 and Figure 2.
In an analysis of CT values for spike genes in 1,077 confirmed cases of COVID-19 cases in Germany, Ade et al. [21] reported that older age was associated with a higher mean CT value, which was particularly prominent in patients aged ≥80 years. In contrast, the present study found that the CT values of the RdRp and E genes were lower when the age of patients increased (Table 1). Further studies are needed to determine whether these differences could be attributed to differences in the genes used for testing.
To control COVID-19, a definitive test for SARS-CoV-2 is important for the following reasons. First, early detection and isolation of an infected individual is a core measure for preventing the spread of SARS-CoV-2 because the virus has rapid viral shedding during the early stages of infection [12,22]. Second, the introduction of an accurate test is essential to prevent the global spread of COVID-19, as some patients clinically present with no specific symptoms or are asymptomatic [7,23]. Lastly, COVID-19 symptoms are similar to those of seasonal influenza; hence, screening during the early stages of COVID-19 is necessary, especially for individuals without specific symptoms [24].
One of the advantages of the present study is its attempt to establish a relationship between epidemiological information and quantitative RT-PCR values, leading to the identification of estimated CTR and CTE CIs by interval, as shown in Table 3, which can be used for epidemiological investigations for the control of COVID-19 as follows.
First, it can be used in cases in which one of the CTR and CTE values does not fall within the CIs of the CTR and CTE of the interval that the patients have disclosed. For example, a patient wakes up in the morning and manifests and recognizes COVID-19 symptoms when he/ she decides to be tested and has his/her specimen collected in the afternoon. In this hypothetical case, the results were 22.0 each for the CTR and CTE. As shown in Table 3, the CTE was within the CIs of interval day 0, whereas the CTR was out of the range. Thereafter, the epidemiological investigation team (EIT) determined that the symptoms were not recognized by the patient until the next day due to sleep. A re-evaluation was performed on interval day 1 when both CTE and CTR values were between the CIs. Based on these outcomes, the EIT can then conclude the necessity to extend the range of the contact tracing from -2 days to -3 days based on the day of symptom onset.
Second, it can be used for cases where the CIs of both the CTR and CTE by interval are out of range. For example, a confirmed case disclosed the interval day as one day during the first epidemiological investigation, and both the CTR and CTE values were 23.0. These cases do not fall within the CIs of the 1-day interval in Table 3, but they satisfy the CIs of 3-5 days. In this case, the EIT can predict the presence of mild COVID-19 symptoms, which will allow the patient to recognize the symptoms after two or more days, depending on the difference in the individual level of recognition. Thus, the EIT should reassess the day of symptom onset with the confirmed case through a second epidemiological investigation and then adjust the scope of the epidemiological investigation according to the information disclosed by the case. Because it allows for the additional identification of contacts, it should prevent transmission in the local community.
Finally, another example could be when a person was identified as a contact and underwent an RT-PCR test, obtaining a 30.0. The patient disclosed no COVID-19 symptoms during the epidemiological investigation. In this case, the EIT can consider the following two possibilities for deciding this confirmed case as an asymptomatic case: (1) a case where 8-10 or longer days had passed since the testing day according to the CIs in Table 3, and (2) a case immediately after the infection period has just started. To determine which of these possibilities should be applied, contacts within -2 days of the test day of the corresponding asymptomatic confirmed case should be tested. If these tests confirm new cases, it should be assumed that the infection period began 8-10 days prior, and the case was demonstrated to be a preceding infection; therefore, epidemiological investigations should consider expanding its range.
The major limitations of the present study are as follows. First, the symptom onset days identified by the epidemiological investigation were based only on the description of the confirmed cases. Therefore, the onset day of COVID-19 suspected symptoms can differ depending on the recognition level of the confirmed case; hence, it is subjectively determined [4]. Moreover, the interval days obtained from the cases in the present study might be different by a few days, as described in the first two hypothetical cases, which was also supported by the statistically significant differences in the paired t-test for CTR and CTE values for each case. To overcome this, additional studies should be considered including a large number of test cases who manifested symptoms and were confirmed as having COVID-19 on the second RT-PCR test conducted within 24 hours because of COVID-19-related symptoms during the 14-day self-isolation period after obtaining negative RT-PCR results from contact tracing should be considered [25]. Furthermore, a more valid CTR and CTE range for day 0 can be obtained with more sensitive recognition of the onset of even mild symptoms. However, to overcome the limitation of subjectivity for other interval days, specific interval days obtained from the first epidemiological investigation should be subjected to a test if they fall within the estimated CIs of CTR and CTE, as in the first two hypothetical cases, and reflected in the second epidemiological investigation. Second, the interval in the present study was limited to 0-10 days. Thus, further studies should be conducted at intervals of 11 days or longer. Third, the subjects were limited to residents of a specific region; therefore, the results may differ from those of residents of other provinces or countries. However, it may not be expected to show a marked difference because all subjects were exposed to COVID-19 for the first time, and the CT value is a measure of the SARS-CoV-2 gene. The population vaccination program was not initiated until the study subjects were selected. Finally, the period covered in this study was before the COVID-19 variant became the dominant species. In other words, as mutations such as delta and omicron become the dominant species, the direct application of the results of this study is limited. However, if the same analysis methodology used in this study is applied to future strains, the infection period can be estimated and reflected in epidemiological investigations. Future studies should attempt to estimate the CTR and CTE values more accurately through further analysis of more confirmed cases.
 PDF Links
 PubReader
 ePub Link
 Full text via DOI
 Download Citation
 Print
Print