Impact of monthly arteriovenous fistula flow surveillance on hemodialysis access thrombosis and loss
Article information

Abstract
Arteriovenous fistula flow dysfunction is the leading cause of vascular access thrombosis and loss in patients undergoing hemodialysis. However, data regarding the influence of access flow rate measurements on the long-term outcomes of access are limited. This study aims to identify accesses at a high risk of thrombosis and loss among patients undergoing hemodialysis by measuring the access flow rate and exploring an optimal threshold value for predicting future access thrombosis. We enrolled 220 patients with arteriovenous fistula undergoing hemodialysis. The primary outcome was the occurrence of access thrombosis. Access flow rates were measured monthly using the ultrasound dilution method and were averaged using all measurements from patients with patent access. In patients experienced access thrombosis, those immediately before the thrombosis were selected. Using these data, we calculated the access flow rate threshold for thrombosis occurrence by analyzing the receiver operating characteristic curve, and the patients were divided into two groups according to whether access flow rates were higher or lower than 400 mL/min. During a median follow-up period of 3.1 years, 4,510 access flows were measured (median measurements per patient, 33 times; interquartile range, 11-54). A total of 65 access thromboses and 19 abandonments were observed. Access thrombosis and loss were higher in the lowflow group than in the high-flow group. This study revealed that low access flow rates are strongly associated with access thrombosis occurrence and subsequent loss of arteriovenous fistulas in patients undergoing hemodialysis.
INTRODUCTION
Well-functioning arteriovenous vascular access (VA) is the basis for maintaining successful hemodialysis (HD); however, thrombosis is the leading cause of VA loss in patients with end-stage renal disease (ESRD) undergoing HD [1]. Thus, the latest 2019 kidney disease outcomes quality initiative (K/DOQI) guidelines recommend monitoring, including a detailed physical examination of the arteriovenous VA, by a knowledgeable and experienced health practitioner [2] because such careful physical examination can reveal meaningful VA flow dysfunction. However, such clinical assessments are subjective and require well-trained expert staff who may not be readily available at every HD unit.
One of the indicators of an imminent thrombosis is a reduction in the blood flow rate (Qa) across the VA. Measuring the VA Qa using non-invasive techniques, such as the ultrasound dilution method (UDM), is one of the most commonly used tools to predict subsequent thrombotic events in clinical practice [3-8]. However, data on the effectiveness of this technique in predicting the risk of thrombotic events and improving the longevity of arteriovenous fistulas (AVF) are limited [5-7,9]. Another issue is the insufficient evidence to determine the best possible Qa cutoff value with sufficient sensitivity to detect AVF with a high risk of thrombosis but with good specificity to avoid unnecessary interventional procedures.
Therefore, this study aims to identify VA at a high risk for thrombotic events and consequent loss among patients undergoing HD and investigate whether it can be achieved by monthly measurement of Qa with UDM. In addition, we explored the ideal Qa cutoff value for predicting VA thrombosis occurrence.
METHODS
1. Study participants
Patients with ESRD treated with regular HD via upper extremity AVF functioning at the HD unit of Jeju National University Hospital in South Korea were included in this study. The inclusion criteria were patients aged 18 years and had their Qa measured using UDM for at least 6 months between April 2018 and March 2023. Patients with prosthetic arteriovenous grafts (AVG) were excluded. Similarly, those who did not have a single venous segment of sufficient length (≥4 cm) for measuring Qa owing to the development of early collateral veins immediately beyond the anastomosis were excluded. Patients with VA-related complications, such as access infection in the previous 3 months, and those with inadequate data on Qa (<6 measurements) were excluded. This study was approved by the Jeju National University Hospital Institutional Review Board and was conducted in accordance with the declaration of Helsinki (No. 2023-04-001).
2. Clinical data, including measurement of VA flow rate
The Qa was measured monthly using a Transonic HD03 Hemodialysis flow monitor (Transonic Systems Inc., Ithaca, NY, USA) within the first 1.5 hour of the HD session when hemodynamic instability related to ultrafiltration did not affect Qa. Single-pool dialysis adequacy measure (Kt/V) was assessed every 3 months. Demographic data, including age, sex, cause of ESRD, and presence of diabetes mellitus (DM), hypertension, and cardiovascular diseases (CVDs), including coronary artery disease, stroke, and peripheral vascular disease at enrollment, were obtained from our hospital database. Coronary artery disease was defined via clinical symptoms such as chest pain or dyspnea on exertion, laboratory findings, electrocardiography, and coronary angiography. Stroke was defined via computed tomography or magnetic resonance imaging of the brain. Peripheral vascular disease was diagnosed via contrast-enhanced computed tomography or peripheral angiography or in newly performed intervention therapy or amputation cases.
3. VA imaging and intervention procedures
The dialysis nursing staff examined the AVFs at each dialysis session. Fistulography was performed in cases of clinical suspicion of AVF flow dysfunction, including prolonged (≥30 minutes) post-dialysis bleeding from AVF venopuncture sites, development of upper-extremity edema, VA cannulation difficulties with a 15-G needle, aspiration of clots during cannulation, high venous pressure (>250 mmHg) and negative arterial pressure (<-250 mmHg), and an unexplained reduction in the Kt/V (>0.2). Qa can show high variability based on needle placement or hemodynamic status [10], and patency can be maintained at relatively low flow rates in some AVFs [9,11,12]. Thus, patients with a Qa that declined by >25% with regard to the mean Qa value over 6 months (regardless of the Qa value per se) underwent fistulography based on previous K/DOQI guidelines [13]. Subsequent percutaneous transcutaneous angioplasty (PTA) or surgery was performed according to the radiologist’s judgment.
4. VA flow value for predicting VA thrombosis
Qa values were averaged using all measurements until the end of the study (March 2023) in patients with patent AVF. In contrast, in patients who experienced AVF thrombosis during the follow-up period, those immediately before the thrombosis were selected. The Qa values were categorized at 50 mL/min intervals for subsequent analyses. Using the Qa results mentioned above, we constructed a receiver operating characteristic (ROC) curve for the predictive value of Qa for VA thrombosis by plotting the sensitivity versus false-positive rate at different cutoff levels of the predictor being tested. The diagnostic adequacy of the different test thresholds was defined as the sum of true-positive and true-negative results. The threshold of Qa <400 mL/min was chosen based on its good adequacy (88.2%) in detecting AVF at the risk of incipient thrombosis, with 80.0% sensitivity and 91.6% specificity, and patients were divided into two groups, according to whether the Qa values were higher or lower than 400 mL/min.
5. Outcome measures
The primary outcome was the difference in VA thrombosis occurrence requiring angioplasty or surgical access revision between the two groups. Cumulative patency rates, defined as access survival until AVF abandonment, and the composite outcomes of VA thrombosis and/or loss were evaluated and compared as secondary outcomes. Patients with functional AVFs were censored in the event of death, transplantation, transfer to another HD unit, access abandonment, or the end of the study.
6. Statistical analysis
Characteristics at the time of enrollment were presented as mean±standard deviation (SD) or median (interquartile range [IQR]), depending on the data distribution (continuous variables) or frequencies and percentages (categorical variables), as appropriate. The two groups were divided based on a Qa of more or less than 400 mL/min and were compared using the Student’s t-test or Mann-Whitney test for continuous variables and the chi-square or Fisher’s exact test for categorical variables. The thrombosis-free survival and cumulative patent times for each group were computed from the time of the first examination of the Qa to the last follow-up visit or the VA thrombosis or loss date, were analyzed, and were compared using the Kaplan–Meier method and the log-rank test, respectively. A Cox proportional hazards model was used to evaluate the association between risk factors and the occurrence of VA thrombosis. The significant risk factors reported in an univariate analysis, including age, history of stroke, peripheral vascular disease, and VA thrombosis, and possible risk factors for VA thrombosis, such as sex, HD vintage, and VA location, were analyzed using a multiple regression analysis. Statistical significance was set at a P-value of <0.05. All statistical analyses were performed using the SPSS Statistics software (version 18.0; IBM, Armonk, NY, USA).
RESULTS
1. Patient characteristics
A total of 293 patients were evaluated for eligibility; of which, 70 who underwent AVG were excluded. Three patients were unsuitable for Qa measurements, and thus were excluded from the study. Ultimately, 220 patients with ESRD undergoing HD were included in the study. The baseline characteristics of the study population are presented in Table 1. There were 143 men (65.0%) and 77 women (35.0%) with a mean±SD age of 68.6±15.3 years. The causes of ESRD were DM (n=116, 52.7%), hypertension (n=63, 28.6%), chronic glomerulonephritis (n=32, 14.5%), autosomal dominant polycystic kidney disease (n=4, 1.8%), and other diseases or unknown etiologies (n=5, 2.3%). The median HD vintage was 1.9 years (IQR, 0.4-4.1). Most patients received HD three times a week for 4 hours, with blood and dialysate flow rates of 250 and 500 mL/min, respectively. Patients received anticoagulant therapy with unfractionated heparin or nafamostat for blood circuit clotting prevention during HD. The urea clearance exhibited a mean single-pool Kt/V of 1.53±0.25. Moreover, 126 patients (57.3%) had DM, and most patients (n=209, 95%) were receiving antihypertensive medications, including angiotensin-converting enzyme inhibitors, angiotensin II receptor blockers (n=78, 35.5%), beta-blockers (n=101, 45.9%), calcium channel blockers (n=108, 49.1%), and vasodilators (n=48, 21.8%). Furthermore, 106 patients (48.2%) were on antiplatelet agents such as aspirin, clopidogrel, and/or cilostazol, and 94 patients (42.7%) were treated with 3-hydroxy-3-methyl-glutaryl-CoA-reductase inhibitors. CVDs were present in 111 patients (50.5%), and approximately one-quarter (n=54) had a history of VA thrombosis at enrollment. AVFs were located in the lower and upper arms in 145 (65.9%) and 75 patients (34.1%), respectively.

Characteristics of patients whose arteriovenous fistula flow rate was less (group 1) or more than 400 mL/min (group 2) throughout the follow-up period
2. VA flow rate and thrombosis
The patients were followed-up for a median of 3.1 years (IQR, 1.1-5.0), during which, 38 (17.3%), 26 (11.8%), and six patients (2.7%) passed away, were transferred to other dialysis units, and received kidney transplantations, respectively. Between April 2018 and March 2023, 4,510 Qa were measured (median measurements per patient, 33 times; IQR, 11-54), and the median Qa value was 737 mL/min (IQR, 333-1,233). The Qa in patients with upper-arm AVFs was significantly higher than that in patients with AVFs in the lower arm (median, 1,041; IQR, 555-1,541 mL/min vs. median, 598; IQR, 290-975 mL/min; P<0.001). Moreover, 100 fistulographies and/or PTAs were performed because of the aforementioned clinical indications (n=63), a significant reduction (>25%) in Qa with regard to the mean Qa value over the previous 6 months (n=27), or a reduction in the dialysis dose delivered (n=11). During the study period, 65 (29.5%) thrombotic and 19 (8.6%) VA abandonment events occurred in 220 patients. Among those who experienced VA thrombosis, >60% (n=40) had thrombosis at the juxta-anastomosis site and/or draining veins (juxta-anastomosis site only, n=14; 21.5%). Three (4.6%) thromboses in the inflow stenotic artery caused by atherosclerosis and 11 (16.9%) thrombotic events in the outflow veins >2 cm distal to the anastomosis were found. Eleven patients (16.9%) had diffusely organized thrombosis through AVFs.
3. Prediction accuracy of VA thrombosis according to flow rate
The optimal cutoff value of Qa for predicting the future occurrence of VA thrombosis was 400 mL/min in the ROC curve analysis, with a sensitivity of 80.0%, specificity of 91.6%, and adequacy of 88.2% (area under the ROC curve [AUC], 0.908; 95% confidence interval [CI], 0.863-0.953, P<0.001) (Fig. 1). When the diagnostic adequacy of predicting VA thrombosis was evaluated for different thresholds, applying a threshold slightly higher or lower than 400 mL/min did not increase the adequacy of detecting AVFs at the risk of subsequent occurrence of VA thrombosis (350 mL/min; sensitivity, 70.1%; specificity, 92.3%; adequacy, 85.9% vs. 450 mL/min; sensitivity, 80.0%; specificity, 88.4%; adequacy, 85.9%). The characteristics of the patients whose Qa was less (group 1) or more than 400 mL/min (group 2) are listed in Table 1. The two groups had no significant differences regarding sex, HD duration, the incidence of comorbid DM, hypertension, history of VA loss, or ESRD etiology. Both groups had similar frequencies of antihypertensive, antiplatelet, and lipid-lowering drug use. However, age at the time of enrollment was higher in patients who had Qa value of <400 mL/min than in those with a Qa value of >400 mL/min (73.7±12.4 vs. 66.4±15.9 years; P=0.001). In addition, a history of peripheral vascular disease (26.2% vs. 6.5%; P=0.002) and VA thrombosis (70.8% vs. 38.7%; P<0.001), and the frequency of lower-arm AVF use (78.5% vs. 60.6%; P=0.011) were higher in group 1 than in group 2.

Receiver-operating characteristics curve for vascular access flow rate during the follow-up period for detecting patients at risk of access thrombosis occurrence. The cutoff value was 400 mL/min with a sensitivity of 80.0% and a specificity of 91.6%. AUC: area under the curve, CI: confidence interval.
4. VA access thrombosis and/or loss
When VA thrombosis-free survival was compared between the two groups according to whether the Qa value was above or below 400 mL/min, it was lower in patients who had a Qa value of <400 mL/min during the follow-up period than in patients with a high Qa value of ≥400 mL/min (P<0.001) (Fig. 2). In addition, patients in group 1 showed a significantly greater loss of VA than that in patients in group 2 during the follow-up period (16.9% vs. 5.2%; P=0.005) (Fig. 3). When the composite outcome was compared between the two groups, the low-flow group had increased VA thrombosis and/or loss compared with that in the high-flow group (80% vs. 10.3%; P<0.001). However, no difference in VA thrombosis-free survival was noted between patients with AVFs in the upper and lower arms (P=0.315).
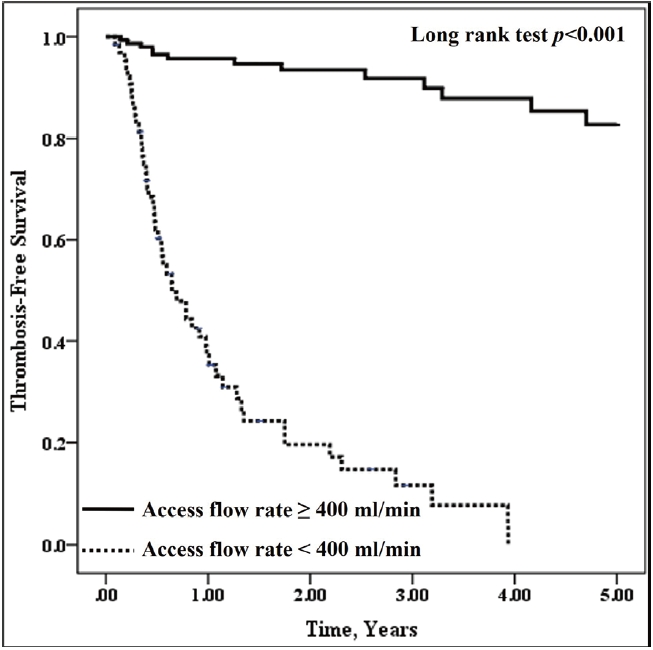
Thrombosis-free patency of arteriovenous fistula in the low (<400 mL/min, dotted line) and high (≥400 mL/min, solid line) access flow rate groups during the follow-up period.

Cumulative patency of arteriovenous fistula in the low (<400 mL/min, dotted line) and high (≥400 mL/min, solid line) access flow rate groups during the follow-up period.
5. Predictors of VA thrombosis
To evaluate the clinical indicators of VA thrombosis, we first performed a univariate Cox proportional hazards analysis (Table 2). Older age (hazard ratio [HR], 1.042; 95% CI, 1.020-1.064; P<0.001), history of stroke (HR, 1.884; 95% CI, 1.154-3.076; P=0.031), peripheral vascular disease (HR, 2.809; 95% CI, 1.677-4.705; P=0.005), VA loss (HR, 2.296; 95% CI, 1.119-4.711; P=0.023), and low Qa values (<400 mL/min) during the follow-up period (HR, 23.355; 95% CI, 11.867-45.965; P<0.001) were significantly associated with an increased occurrence of VA thrombosis. In contrast, HD vintage (HR, 1.113; 95% CI, 0.915-1.354; P=0.286), the presence of DM (HR, 1.271; 95% CI, 0.771-2.096; P=0.348), hypertension (HR, 2.182; 95% CI, 0.533-8.927; P=0.278), the use of antiplatelet agents (HR, 1.615; 95% CI, 0.784-3.329; P=0.194), anticoagulants (HR, 0.651; 95% CI, 0.237-1.792; P=0.406), and location of VA (HR, 1.321; 95% CI, 0.774-2.254; P=0.308) were not associated with the occurrence of VA thrombosis. Independent risk factors for the primary outcome were assessed using a multivariate Cox proportional hazards analysis (Table 3). Older age (HR, 1.021; 95% CI, 0.996-1.046; P=0.102) and a history of peripheral vascular disease (HR, 0.978; 95% CI, 0.541-1.769; P=0.941) were not associated with VA thrombosis. Only a history of stroke (HR, 1.806; 95% CI, 1.056-3.086; P=0.031) and VA thrombosis (HR, 2.936; 95% CI, 1.393-6.192; P=0.005), and low Qa values (<400 mL/min) during the follow-up period (HR, 23.401; 95% CI, 11.002-49.776; P<0.001) were predictors of VA thrombosis.

Univariate predictors for the occurrence of arteriovenous fistula thrombosis

Multivariate predictors for the occurrence of arteriovenous fistula thrombosis
DISCUSSION
The 2019 K/DOQI guidelines recommend regular physical examination of the AVF by a trained dialysis provider instead of routine AVF surveillance by measuring access blood flow as there is inadequate evidence on its measurement [2]. However, not all HD units have experienced individuals perform this examination. Moreover, several studies have reported that subclinical access f low dysfunction may not be detected on physical examination alone [6,8,14]. Thus, the 2019 guidelines commented on the complementary role of surveillance in routine clinical monitoring, as the well-timed identification of VA with flow dysfunction is vital for preserving their function [2].
Among VA surveillance methods, measuring Qa using UDM has been a readily applicable tool owing to its sensitivity and accuracy and can be performed at the bedside more frequently and regularly without a heavy workload on the dialysis staff compared with other methods such as Doppler ultrasonography (DUS) [3,6,15,16]. Since the introduction of UDM in 1995, numerous studies have investigated the usefulness of Qa measurements in detecting access flow dysfunction and predicting future access thrombosis. However, only a few studies have evaluated the impact of Qa surveillance on AVF longevity, and the results have been inconsistent [5-7,9]. A prospective randomized controlled trial (RCT) conducted in Italy reported that the risk of thrombosis was significantly reduced, and the cumulative patency of AVF was improved in the group that was surveyed with trimonthly Qa measurement using UDM compared with in the control group during a follow-up period of 5 years, suggesting that regular Qa measurement can help increase the overall life of VA [5]. In addition, an open-label, prospective, multicenter RCT with a 3-year follow-up in Spain showed that Qa-based surveillance reduced the frequency of thrombosis and improved the thrombosis-free and secondary patency of AVF [6]. Recently, the association between monthly surveillance of AVF using UDM and a reduced number of thrombotic events per patient was demonstrated in the largest RCT in the USA [7]. In contrast, a single-center longitudinal observational study reported that monthly access flow monitoring with increased prophylactic angioplasty (0.67 vs. 0.09 per access-year) did not improve the thrombosis rate or cumulative fistula patency [9]. However, all these studies were limited because they included a small number of patients (n=79) with only AVF with subclinical stenosis and a low Qa of <500 mL/min [5], used historical rather than concurrent controls [9], evaluated patients with a high risk of VA thrombosis identified and hemodynamically proven by UDM and DUS, which can cause an extra burden on HD staff [6], did not separately analyze patients who had AVFs from those who had AVGs, or did not enroll the targeted number of patients, resulting in insufficient power to unveil the impact of access surveillance on the outcomes of VA [7]. In this study, we investigated the clinical usefulness of monthly measuring Qa among patients undergoing HD with functional AVF and reported that patients who had a Qa of <400 mL/min during the follow-up period (median, 3.1 years; IQR, 1.1-5.0) had greater risks of VA thrombosis and loss than the risks of those who had greater Qa. Thus, in agreement with the aforementioned studies [5-7], our findings suggested that regular AVF flow measurements using UDM can identify a subset of patients at an increased risk of future VA thrombosis and loss.
Qa thresholds in AVF for referral to angiography vary according to different guidelines, ranging from 300 to 500 mL/min [13,17-19]. However, such recommendations are mainly based on very few previous studies that used ROC curve analysis. In a prospective controlled open trial of patients with mature forearm AVFs, Tessitore et al. [4] reported that the optimal cutoff value of Qa as the best predictor of incipient thrombosis was <300 mL/min. However, one limitation of their study was that the predictive role of the appropriate threshold for thrombosis was evaluated in a relatively small number of patients (n=65) over a relatively short period (median, 12 months). Moreover, in a long-term (5 years) follow-up study of 79 patients undergoing HD with mature forearm AVF, they reported that the cutoff point for intervention and prevention of the risk of thrombosis was a Qa of 350 mL/min, suggesting that a Qa of >350 mL/min before intervention can lead to a superior outcome with preemptive action in AVFs [5]. The Qa thresholds of 300-350 mL/min are among the lowest reported values. However, selecting such low thresholds may increase the risk of thrombosis in patients undergoing HD, although unnecessary procedures are avoided. In addition, an Australian study confirmed that flow measurement using the online thermodilution method is a valuable tool for predicting AVF failure, and an optimal discriminatory cutoff value of 576 mL/min gives a sensitivity of 89% and a specificity of 81% in ROC curve analyses [20]. As the Qa threshold has been reported to depend on the methods used [16], the disparity in monitoring methods may be associated with differences in the appropriate cutoff values among previous studies. In addition, the AVF function was explored within 6 months, which is not long enough to evaluate the overall outcomes of VA. A recent retrospective study on 302 patients undergoing HD in Taiwan reported that the minimum Qa required to maintain access function was associated with individual ideal body weight (IBW) for radiocephalic AVFs with a Qa of <500 mL/min, and the best cutoff value of Qa was 7.1 times that of IBW [8]. However, they enrolled only a small number of patients (n=52) with AVF with subclinical stenosis and a low Qa (<500 mL/min). In addition, they reported the ideal threshold of Qa as an IBW-based form in just 1 year. Altogether, there is inadequate evidence supported by large RCTs on whether different Qa criteria influence the long-term outcomes of AVF. In the present study, an ROC curve analysis showed that a Qa of 400 mL/min had a high predictive ability for imminent thrombosis, with an AUC of 0.908, indicating that measuring Qa is helpful in clinical practice for identifying patients at a high risk of VA thrombosis. This threshold is similar to that suggested by previously published guidelines as the best predictor of thrombosis in AVFs [13] and slightly higher than those identified in previous studies [4,5]. In their study, all patients had forearm AVFs; the flow rates of which were usually lower than those of upper-arm AVFs. In contrast, more than one-third of the patients (34.1%) had upper-arm AVFs in our study, suggesting that the different AVF locations might explain the discrepancy in the threshold Qa value between that study and ours. Regarding the long-term outcomes of VA, our patients who had Qa of <400 mL/min showed significantly greater AVF loss than those with a Qa of >400 mL/min during a follow-up period of up to 5 years, suggesting that a drop in Qa to <400 mL/min is associated with subsequent VA thrombosis and loss.
The sustained maintenance of VA patency without flow dysfunction is essential and can affect the prognosis of patients undergoing HD [1]. Thus, several studies have assessed the risk factors associated with VA thrombosis and/or loss and revealed that many risk factors such as age [21], sex [22], the presence of DM and hypertension [3,15,21], the use of drugs with antiplatelet and/or vascular antiproliferative activity [23], and AVF location [9] are associated with VA thrombosis. However, no factors were consistently associated with AVF thrombosis. Similar to previous findings, older age, female sex, dialysis vintage, the presence of DM and hypertension, the use of antiplatelet agents, and AVF location were not associated with VA thrombosis in the present study. Only a history of stroke and VA thrombosis, and low Qa were predictors of VA thrombosis, indicating that patients with these risk factors should be surveyed and evaluated more carefully to reduce VA thrombosis.
Our study had several limitations. First, it was a retrospective, single-center, observational study, which might not apply to the general population with ESRD undergoing HD. Second, we did not perform angiography, the gold standard for all patients. Patients who did not undergo angiography were assumed to be negative for thrombosis and were included in the AUC calculation. Third, we did not determine the optimal frequency of Qa measurement because all patients underwent Qa measurement every month, based on previously published clinical practice guidelines [13] to detect access flow dysfunction early and permit sufficient lead time for an intervention. Thus, it remains unclear whether more frequent Qa measurements, such as once a month, would identify AVFs at a risk of thrombosis more timely than less frequent surveillance, such as bi- or trimonthly. Further studies are required to define the optimal interval between measurements for early detection of an increased risk of thrombosis and subsequent AVF loss. Fourth, this study did not assess the economic benefits of this strategy. However, national health insurance covers regular monthly Qa measurements in South Korea. Thus, it is unlikely that this type of surveillance will impose a considerable economic burden on patients.
In conclusion, our study revealed that low Qa values during the follow-up period were strongly associated with the occurrence of thrombosis and subsequent loss of AVFs in prevalent patients undergoing HD, suggesting that the detection of patients at a risk for imminent VA thrombosis and loss could be improved by regularly measuring Qa, and patients with a high thrombosis risk profile, such as those with a prior history of VA thrombosis and low Qa, require a more thorough evaluation.
Acknowledgements
None.