Associations of age, body mass index, and breast size with mammographic breast density in Korean women
Article information
Abstract
We aimed (a) to investigate the associations between age, body mass index (BMI), and breast size with mammographic density based on the breast imaging reporting and data system (BI-RADS) and volumetric breast density measurement (VBDM) with Volpara, (b) to evaluate the associations of age, BMI, and breast size with fibroglandular tissue volume (FGV), and (c) to demonstrate the association of mammographic density grade with FGV. From April 2012 to May 2012, 1,203 women consecutively underwent mammography, and their breast density was calculated using the density grade and volume determined by Volpara. In total, 427 women were included in this study. The BMI and breast size of the 427 women were determined. The associations between mammographic density and age, BMI, and bra cup size were assessed. In addition, the associations between FGV and age, BMI, bra cup size, and mammographic density were assessed. The mean age of the women was 51 years (range, 27−83). Age was associated with mammographic density based on BI-RADS (P<0.0001), and both age and BMI were associated with mammographic density based on Volpara (P<0.0001). The mean FGV significantly decreased as age increased (P<0.0001) and increased as BMI and bra cup size increased (P<0.0001 and P=0.0007, respectively). Age was associated with mammographic density, according to both the BI-RADS and VBDM; however, BMI was only associated with mammographic density based on the VBDM. Larger FGV was associated with younger age, higher BMI, larger bra cup size, and higher mammographic density
INTRODUCTION
Mammography revealed the characteristics of breast composition. The stroma and epithelium attenuate X-rays more than fat, and therefore appear light, whereas fat appears dark [1]. Mammographic density is defined as the proportion of radiodense fibroglandular tissue in the breast [2]. Women with dense breast tissue have a 2 to 6-fold higher risk of breast cancer than those with less dense breast tissue [3-5]. Breast density is also reportedly an independent predictor of breast cancer risk [5,6].
Mammographic density is associated with various markers such as race, dietary and nutritional patterns, hormone replacement therapy (HRT), breast size, body mass index (BMI), menopausal status, and age [6-10]. There is a significant inverse relationship between age and mammographic density [11]. Previous reports on the association between mammographic density and BMI are complex. In Western populations, weight gain is positively associated with an increase in the dense tissue area [7,12]. However, a higher BMI was found to be inversely associated with mammographic density in a study of a Chinese population [13] and some studies have found no association between dense tissue area and weight gain [14,15].
Asian women generally have considerably smaller breasts and, thus, a higher percent breast density than Caucasian women [7,8,16]. The effect of mammographic density on breast cancer varies across ethnic groups [7,13]. Few studies have investigated the association between mammographic density and variable determinants, including age, BMI, and breast size, in Korean women [11].
To study the relationship between breast density grade and breast cancer risk, a more objective and quantitative method for assessing breast density and fibroglandular tissue volume (FGV) is required. To overcome the subjectivity in breast density evaluation, volumetric breast density measurement (VBDM) was developed to objectively measure volumetric breast density using data from a digital mammogram that provides not only the overall percentage but also FGV.
We aimed to investigate the association of age, BMI, and breast size with mammographic density based on the breast imaging reporting and data system (BI-RADS) and VBDM; to evaluate the associations of age, BMI, and breast size with FGV based on VBDM; to demonstrate the association of mammographic density grade with FGV; and to compare the measures based on BI-RADS and VBDM in a sample of Korean women.
METHODS
1. Study population
The Institutional Review Board of Yonsei University College of Medicine approved this observational study. Informed consent for medical record review and body size measurements was obtained from each patient. From April 2012 to May 2012, 1,203 women consecutively underwent mammography at our institution, and their breast density was calculated using the density grade and volume determined by Volpara. Of these women, those who agreed to provide a questionnaire collecting data including menopausal status, use of HRT, and measurement of body size on the same day as that scheduled for their mammogram were included. Finally, we identified 427 women who were eligible to participate in this study.
Patients’ ages were classified as <40 years, 40−49 years, 50−59 years, and ≥60 years.
2. Body size measurement
One trained radiographer measured the height, body weight, breast circumference, and chest circumference of the participants. The participants stood erect with their arms at their sides, and breast circumference was measured at the nipple line as viewed from the front in a horizontal line. Underbust chest circumference was measured at the level of the inframammary fold in a horizontal line. BMI was calculated as weight divided by height squared (kg/m2) at the time of the mammography. Adult BMI was categorized into four categories: underweight, <18.5 kg/m2; normal weight, 18.5−25 kg/m2; overweight, 25−30 kg/m2; and obese: ≥30 kg/m2. Bra cup size, which was used to predict breast size, was measured by subtracting breast circumference (in cm) from underbust chest circumference (in cm) and classified into three categories: A, <7.5 cm; B, 7.5−10 cm; and C, >10 cm.
3. Assessment of mammographic density
Mammography was performed using the Lorad/Hologic Selenia full-field digital mammography system (Hologic Inc., Marlborough, NA, USA) and General Electric Senograph Digital Mammography System (General Electric Healthcare, Chicago, IL, USA). Standard mediolateral oblique (MLO) and craniocaudal (CC) mammograms were obtained for all women.
One of seven board-certified radiologists, who was dedicated to breast imaging with either less than 1 year of experience or more than 7 years of experience, independently interpreted the mammographs using a picture archiving and communication system and reported the results in radiological reports in daily practice. The original radiological reports of breast density were reviewed, recorded, and analyzed. Breast density in the original report was classified according to the categories of the American College of Radiology BI-RADS, which has four density categories according to parenchymal structure (grade A, almost entirely fatty, <25% fibroglandular tissue; grade B, scattered fibroglandular tissue, 25−50% fibroglandular tissue; grade C, heterogeneously dense, 51−75% fibroglandular tissue; and grade D, extremely dense, >75% fibroglandular tissue) [17]. For VBDM, the volumes of total breast tissue (cm3) and fibroglandular tissue (cm3) of each breast were automatically measured using Volpara software (version 1.5.1; Volpara Health Limited, Wellington, New Zealand), which automatically calculated the FGV (cm3) and the volumes of total breast tissue (cm3) in each breast (Fig. 1). The overall percentage was defined as the percentage of FGV among the total breast tissue volume and presented as the mean of both breasts. Volpara software was used to calculate breast density in each patient using the overall percentage. Breast density was classified into grades 1, 2, 3, and 4 (1: 0−4.5%, 2: 4.5−7.5%, 3: 7.5−15.5%, and 4: >15.5%), which correspond to grades A, B, C, and D of the BI-RADS classification, respectively.
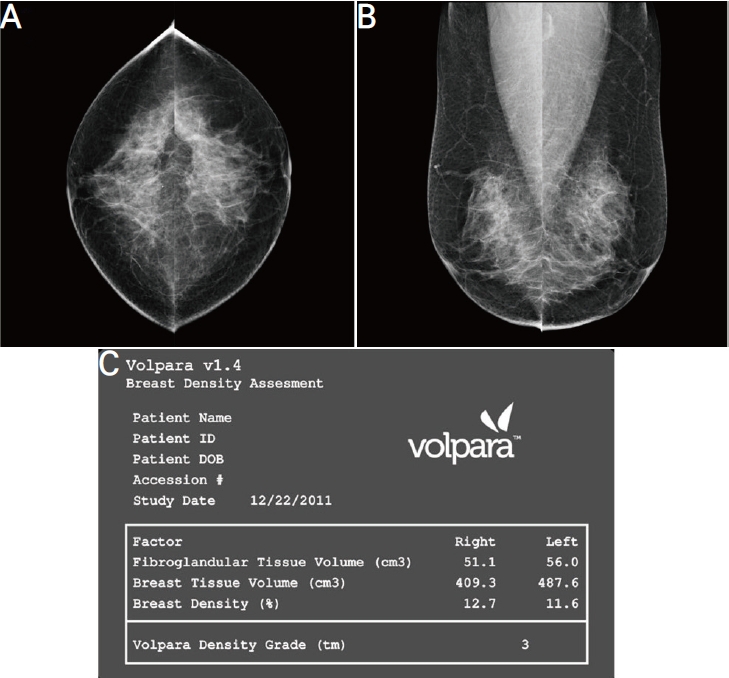
Figure caption
4. Data and statistical analysis
Linear relationships between mammographic density and three variables (age, BMI, and bra cup size) were assessed using linear regression analysis and Spearman correlation coefficient. A multinomial logistic regression model was used to explore predictors of mammographic density such as age, BMI, and bra cup size. Odds ratios (ORs), confidence intervals (CIs), and P-values for tests of variables and differences between mammographic densities were based on Wald statistics. Mammographic density was assessed using radiologists’ estimates based on BI-RADS and Volpara; therefore, two separate analyses were conducted.
One-way analysis of variance (ANOVA) was used to determine whether mean values of overall percent and FGV based on Volpara significantly differed among age, BMI, and bra cup size subgroups. To better illustrate the differences between age, BMI, and bra cup size subgroups, posthoc analysis with Bonferroni correction for multiple comparisons was performed if the ANOVA yielded significant results (P<0.05). A one-way ANOVA with posthoc analysis was also used to determine whether the mean values of overall percent and FGV based on Volpara significantly differed between the four density grades (D1, D2, D3, and D4) defined by the BI-RADS and the four grades defined by Volpara. All data were examined for normality, and all modes were initially adjusted for menopausal status and HRT use. Statistical analyses were performed using the SAS software (version 9.2; SAS Institute, Cary, NC, USA). A P-value less than 0.05 was considered statistically significant. All statistical tests were two-sided.
RESULTS
1. Characteristics of the study participants
Participants’ characteristics are presented in Table 1. The mean age of the 427 women was 51 years (range, 27-83). Of these, 270 (63%) and 157 (37%) underwent mammography for screening and diagnosis, respectively. The mean total breast tissue volume and FGV were 450.3 mL (range, 50.7−1,488.2) and 53.4 mL (range, 10.2−197.7), respectively. According to the BI-RADS classification, 371 (87%) and 56 (13%) women were categorized as having dense (grades C or D) and fatty (grades A or B) breasts, respectively. According to the Volpara classification, 338 (79%) and 89 (21%) women were categorized as having dense (grade 3 or 4) and fatty (grade 1 or 2) breasts, respectively.
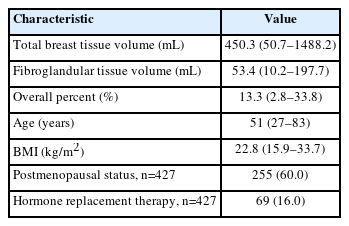
Characteristics of the study population
2. Associations of mammographic density with age, BMI, and bra cup size
Mammography density based on BI-RADS was significantly inversely correlated with age (Spearman’s r=-0.3817, P<0.0001) and BMI (Spearman’s r=-0.1593, P=0.0010). Mammography density based on Volpara was significantly inversely correlated with age (Spearman r=-0.4953, P<0.0001), BMI (Spearman r=0.4304, P<0.0001), and bra cup size (Spearman r=-0.1490, P=0.0020).
In multinomial logistic regression analyses, only age was significantly associated with mammographic density based on BI-RADS (P<0.0001). Both age and BMI were significantly associated with mammographic density based on Volpara (both P<0.0001) (Table 2). Bra cup size was not significantly associated with mammographic density based on BI-RADS or Volpara (P=0.5724 and P=0.3959, respectively) (Table 2). Table 3 shows that age was associated with different mammographic density grades based on both BI-RADS and Volpara, whereas BMI was associated with different mammographic density grades based on Volpara. When assessed by BI-RADS, women with older age were associated with reductions in the possibility of higher mammographic density grades, with ORs of 0.82 (95% CI, 0.75−0.91) and 0.77 (95% CI, 0.69−0.86) for D3 vs. D1 and D4 vs. D1, respectively. Similar findings were made with Volpara, women with older age were associated with reductions in the possibility of higher mammographic density grades, with ORs of 0.88 (95% CI, 0.82−0.94) and 0.80 (95% CI, 0.74−0.86) for D3 vs. D1 and D4 vs. D1, respectively. In addition, women with a higher BMI were associated with reductions in the possibility of being categorized as D4 than D1 when assessed by Volpara, with ORs of 0.65 (95% CI, 0.52−0.82) with statistical significance.
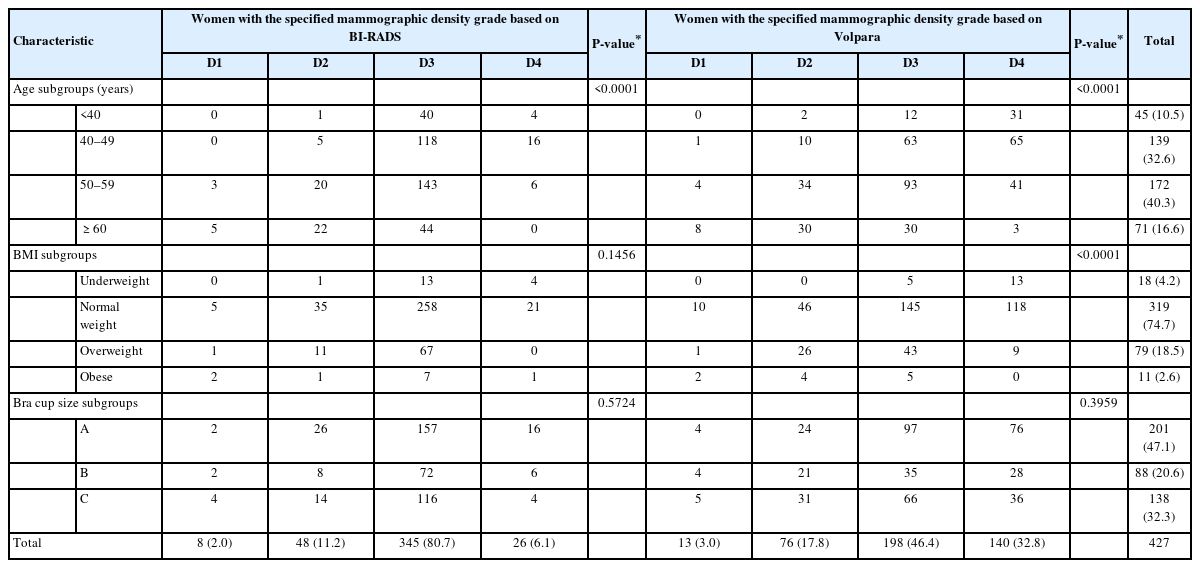
Comparisons of mammographic density between age, BMI, and bra cup size subgroups

Multivariable odds ratios of mammographic densities according to age and BMI
3. Associations of overall percent and FGV based on Volpara with age, BMI, and bra cup size
The mean overall percentage based on Volpara significantly decreased as age, BMI, and bra cup size increased (P<0.0001, P<0.0001, and P=0.0076, respectively) (Table 4). In Post hoc comparisons, the mean overall percentage differed significantly among all four age subgroups, except between the <40 years and 40−49 years subgroups. The mean overall percentage also differed significantly between the following BMI subgroups: underweight vs. normal weight, underweight vs. overweight, underweight vs. obese, and normal weight vs. obese. Post hoc comparisons showed that the overall percentage was lower for women with bra cup size C than for women with bra cup size A (P<0.0076); however, no significant differences were detected in other comparisons of bra cup size subgroups.

Associations of overall percent and FGV based on Volpara with age, BMI, and bra cup size
The mean FGV significantly decreased as age increased (P<0.0001) and increased as BMI and bra cup size increased (P<0.0001 and P=0.0007, respectively) (Table 4). In posthoc comparisons, FGV significantly differed among all four age subgroups, except between the <40 years and 40−49 years subgroups. The FGV also significantly differed between the following BMI subgroups: underweight vs. normal weight, underweight vs. overweight, underweight vs. obese, and normal weight vs. obese. FGV significantly differed between women with bra cup sizes A and B (P<0.0006) and between women with bra cup sizes A and C (P<0.0001).
4. Association of FGV based on Volpara with mammographic density
The mean FGV significantly increased as the density grade based on BI-RADS and Volpara increased (both P<0.0001) (Table 5). In posthoc comparisons, FGV significantly differed only between women with the following mammographic density grades based on BI-RADS: D4 vs. D1, D3 vs. D2, and D4 vs. D2. However, FGV differed significantly among women in all four density grades based on Volpara (P<0.0001).
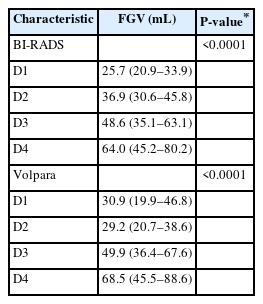
Associations of FGV based on BI-RADS and Volpara with mammographic density
5. Association of mean overall percent based on Volpara with mammographic density based on BI-RADS
The mean overall percentage significantly differed according to the breast density grade based on the BI-RADS (P<0.0001). It significantly differed between women with the following breast density grades: D1 vs. D3, D1 vs. D4, D2 vs. D3, D2 vs. D4, and D3 vs. D4.
DISCUSSION
The mammographic density depends on the proportion of fat, epithelial, and stromal tissues. Multiple reports have demonstrated a strong association between mammographic density and breast cancer risk [4,7,18]. A higher mammographic breast density confers lower mammogram sensitivity and greater breast cancer risk [4,5,7,19]. The absolute area of dense tissue is also associated with an increased risk of breast cancer [7,20], and both dense and non-dense areas independently increase the breast cancer risk [20]. Recently, Kim et al. [21] reported that both a greater dense area and a greater percentage of dense area are associated with an increased risk of breast cancer in Korean women, particularly in young women. In addition, Park et al. [22] and Kim et al. [23] reported that Korean women in their forties have a higher mammographic density grade than Western women of the same age, and breast cancer incidence rates are much lower among Korean women than among Western women. The association between mammographic density and breast cancer risk is relatively weak in Asian women [24-27]. Based on these results, the relationship between mammographic density and breast cancer risk may differ between Korean and Western women.
VBDM was developed to measure breast density using data volumetrically and objectively from digital mammography. It determines the X-ray attenuation between each pixel in the image and the X-ray source. Based on this, the thickness of each tissue type between the pixel and X-ray source can be determined, and the density grade and dense area volume can be acquired. Both mammographic density grade and FGV should be incorporated into risk stratification in population-based breast cancer screening, and VBDM would be more helpful than the BI-RADS classification of mammographic density in providing objective measures.
Multiple studies have reported conflicting results on the relationship between breast density and race. del Carmen et al. [6] found that breast density appears to be highest in Asian women and lowest in African American women but does not differ across racial groups except Asians when controlling for BMI and age. Another study reported that mammographic density is significantly higher in Asian-American women than in African-American women [16]. However, this difference was no longer significant after adjusting for age and BMI. This suggests that the absolute dense area reflects the lower breast cancer incidence rates in Asian American women better than the percent mammographic density because these women have a smaller absolute dense area and similar mammographic density grade compared to African American and white women [16].
To use mammographic density as an index of breast cancer risk, it is important to identify the factors influencing it. However, few studies have investigated the association between mammographic density and variables that can affect mammographic density grades in Korean women [10,23]. Thus, we aimed to assess the association of mammographic density and FGV with age, BMI, and breast size. In addition, we aimed to assess the association between mammographic density and FGV.
As expected, our study found a significant inverse relationship between age and mammographic breast density based on both the BI-RADS and VBDM. Multiple studies consistently documented that mammographic density decreases as age increases [23,28,29]. We found that the majority of patients (98% by BI-RADS and 96% by VBDM) aged 40−49 years had dense breast tissue, whereas 45−48% of Western women in their 40s were reported to have dense breast tissue [29]. Although the percentage of women aged 60 years or older with dense breast tissue decreased to 62% (by BI-RADS) and 46% (by VBDM), a significant proportion of these women had high mammographic density, and the proportion of women with dense breast tissue in the current study was higher than that of Western women with dense breast tissue in a previous study in all age groups [29].
In our study, BMI was negatively associated with breast density grade as determined by VBDM, which is consistent with previous studies on Korean women [10]. Although an inverse association between BMI and mammographic density has been consistently reported in several studies [13,30], conflicting results have been reported regarding the association between FGV and BMI. FGV (absolute dense area) was positively associated with BMI in our study. However, a previous study reported that BMI was inversely associated with not only percent dense area but also absolute dense area [10]. Furthermore, BMI was strongly and positively associated with the total area of the mammogram and the non-dense area, and less strongly and negatively associated with the dense area in other studies [30,31]. Studies reporting an inverse or no association between BMI and FGV are mostly from Western populations. However, several studies found a positive association between BMI and FGV, especially when the absolute dense volume was based on a volumetric method instead of an area-based method for measuring dense breast tissue [32-35], consistent with our study’s results. Furthermore, studies on Chinese women found a positive association between BMI and FGV [13], consistent with the results of our study. Additionally, they found a significant and positive correlation between BMI and dense tissue among women with a lower BMI and a significant and positive correlation between BMI and non-dense tissue among women with a higher BMI [13]. We presume that as BMI increases, FGV and fat tissue amount increase, but the amount of fat increases more than FGV, leading to a negative correlation between BMI and breast density. Therefore, although the association between BMI and percent density is mainly due to the contribution of fatty tissue, the dense area also contributes to the interaction of BMI, particularly in Asian women and women with a lower BMI.
Fibroglandular tissue represents the population of breast cells at risk of carcinogenic transformation, and high BMI and FGV are considered to be risk factors for breast cancer [7,16,18]. Stone et al. [36] analyzed the factors that best predict breast cancer risk among fibroglandular tissue, non-dense area, percent density, or a combination thereof; the fibroglandular tissue was a stronger predictor of breast cancer risk than percent density. There is increasing evidence that breast cancer risk is related more to fibroglandular tissue than to the percent density [18,37,38]. Therefore, software such as VBDM, which provides a dense area volume, can accurately reflect the risk of breast cancer. In addition, Volpara determines FGV using volumetric methods, and its measurements show very strong correlations with volume measurements by magnetic resonance imaging and may realistically reflect dense tissue volume on a mammogram [39].
We found that BMI was not associated with mammographic density based on the BI-RADS. This might be due to the subjectivity of BI-RADS-defined density categorization. More women were categorized as having high breast density grades (D3 or D4) by the BI-RADS than by the VBDM (20.8% [89 of 427] vs. 13.1% [56 of 427]). Although FGV may account for less than 50% of the total breast volume, a large amount of fibroglandular tissue in some areas of the breast may prompt the radiologist to report the breast density as D3 rather than D2 because focal density may obscure abnormal growth. In addition, if fibroglandular tissue is uniformly dispersed throughout the breast, the radiologist may report a fatty breast rather than a high breast density grade, although fibroglandular tissue may account for more than 50% of the total breast volume. If density evaluations differ between the CC and MLO views or between the right and left breasts, radiologists generally assess breast density according to the view or the side showing greater density.
In the present study, there was no correlation between bra cup size and mammographic density based on BI-RADS or Volpara. Larger breast size is associated with a larger nondense area, which reflects the amount of fat rather than the FGV. Korean women have smaller breasts than Western women, and a larger proportion of Korean women than Western women in the same age group have density classifications C or D. This may explain the lack of a significant association between mammographic density and breast size.
We found that a higher mammographic density grade resulted in an increased FGV, with FGV significantly differing according to the density grade. This association was stronger for mammographic density based on Volpara than for that based on BI-RADS. No study has explored the association between FGV and mammographic density, and further studies are needed to confirm our findings. We further assessed the association between mean overall percentage and breast density grade based on the BI-RADS. We found a significant positive association between the overall percentage and mammographic density grade based on BI-RADS. This result suggests that the categorization of the continuous variable of the overall percentage sufficiently reflects the conventional BI-RADS density classification.
Our study had some limitations. First, selection bias was unavoidable due to the retrospective study design. This limitation can be overcome by conducting large-scale prospective studies in the future. Second, we only used Volpara to assess the FGV. Further research using other types of VBDM is needed to confirm the relationship between FGV, influencing factors (age, BMI, and bra cup size), and mammographic density. Third, mammographic density grade based on BI-RADS was assessed by seven radiologists with different training backgrounds; however, our results reflect the conditions for determining breast density categories using BI-RADS in daily practice. Despite these limitations, our study is meaningful because we report the results from VBDM, which provides more reproducible and objective information than BI-RADS and can be utilized as principal evidence for further studies.
In conclusion, we determined that mammographic density based on Volpara was inversely associated with age and BMI, while mammographic density based on BI-RADS was inversely associated with age only. FGV was negatively associated with age and positively associated with BMI and bra cup size. Additionally, FGV was positively associated with mammographic density, and this association was stronger when density grades were based on VBDM. Accumulating evidence indicates that breast cancer risk is more directly associated with the absolute area of dense tissue than with the percentage of dense tissue, and a positive correlation between FGV and BMI has been reported, especially among Asian women. Assessment of the role of FGV as a predictor of breast cancer risk is important, and VBDM may help estimate dense tissue volume. Further studies are needed to determine how FGV can be used for breast cancer risk stratification in the clinical setting.